Machine telemetry
Vitals.
Monitor CPU load, memory, cooling, power and running processes on an Apple Silicon Mac.
The dashboard
Why it was built
A build or local model run can make an Apple Silicon Mac work hard without making it clear which resource is under pressure. Vitals puts the hardware readings, process load and cooling response in one view. The menu-bar readout keeps the essential numbers available during ordinary work; the full dashboard is there when a machine needs diagnosis.
What it does
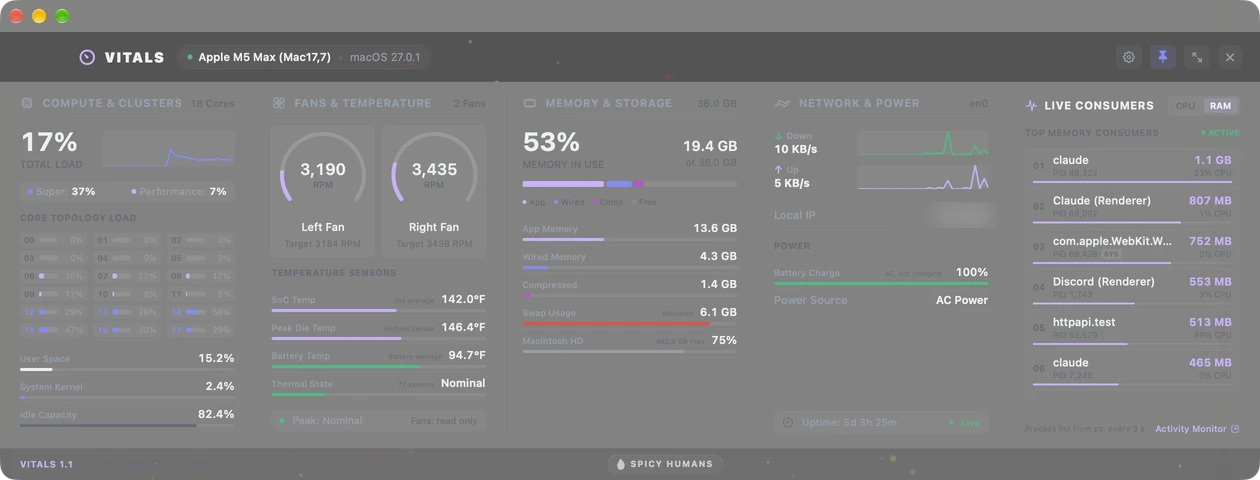
Vitals groups readings into five sections: compute (total load, the two core clusters split out, and every core in a topology grid), cooling (each fan's current RPM against the RPM the controller is asking for, then die, peak and battery-pack temperatures), memory and storage, network and power, and live consumers — the processes using resources right now, sorted by CPU or by RAM.
The numbers come from the hardware. Fan speeds are read from the SMC through IOKit and temperatures from the Mac's own temperature sensors; the cluster load, memory pressure, disk, network and power figures come from the kernel's own counters, and the process list comes from ps. Vitals reads the fans but does not control them. Nothing is inferred from a benchmark, and nothing is sent anywhere: there is no account, no telemetry upload, no network call the app makes on its own behalf.
How it's built
- The app
- Swift and SwiftUI with an AppKit shell, built as a plain macOS bundle. No framework beyond what ships with the system.
- The readers
- One small reader per subject — SMC, CPU, memory, disk, network, power, thermal, process — each returning a plain value type. A single telemetry engine polls them and publishes one snapshot per tick. The two slow readings, temperatures and the process list, are taken off the main thread.
- Fans
- Read only. Vitals shows each fan's speed, the speed the system is asking for and the range the fan reports. It does not set fan speeds; macOS controls the fans.
- The menu bar
- A modular readout: choose which figures ride in the menu bar, in which order, with which delimiter. It is the part that gets used most, so it is the part with the most settings.
- Colour
- Muted ground, one pastel per department, and the accent reserved for state. Each section has its own accent color to help distinguish the readings.
Availability
Vitals is in daily use on an Apple Silicon Mac. A menu-bar readout provides a quick check; the full dashboard shows the detailed readings.
Installer for Apple Silicon
The download includes an installer script that copies the app to Applications. Review the script before running it; macOS may ask you to approve an app from an unidentified developer.
Download Vitals-Installer.dmg · 2.4 MB
Installation: Open the DMG, inspect Install Vitals.command, then run it if you choose to install the app to /Applications. You can also drag the app to Applications. macOS may require an explicit approval in System Settings → Privacy & Security on first launch.